Monthly Production Report for February,2021
Monthly Production Report for February,2021
- Production of Crude Oil
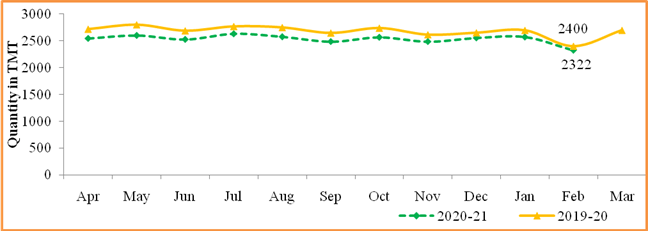
Crude oil production[1] during February,2021 was2322.32 TMT which is6.89% lower than target and3.22% lower when compared with February, 2020.Cumulative crude oil production during April-February, 2020-21 was 27878.81 TMT which is 5.65% and 5.41% lower than target for the period and production during corresponding period of last yearrespectively. Unit-wise and State-wise crude oil production is given at Annexure-I. Unit-wise crude oil production for the month of February, 2021 and cumulatively for the period April-February, 2020-21 vis-à-vis same period of last year has been shown in Table-1 and month-wise in Figure-1.
Table-1: Crude Oil Production (in TMT)
| Oil Company | Target | February (Month) | April-February (Cumulative) | ||||||
| 2020-21 (Apr-Mar) | 2020-21 | 2019-20 | % over last year | 2020-21 | 2019-20 | % over last year | |||
| Target | Prod.* | Prod. | Target | Prod.* | Prod. | ||||
| ONGC | 20931.68 | 1579.89 | 1544.84 | 1672.97 | 92.34 | 19163.56 | 18469.67 | 18848.85 | 97.99 |
| OIL | 3121.00 | 244.98 | 218.49 | 240.26 | 90.94 | 2848.51 | 2687.75 | 2852.55 | 94.22 |
| PSC Fields | 8265.00 | 669.28 | 559.00 | 486.33 | 114.94 | 7536.85 | 6721.39 | 7770.91 | 86.49 |
| Total | 32317.68 | 2494.14 | 2322.32 | 2399.55 | 96.78 | 29548.91 | 27878.81 | 29472.31 | 94.59 |
Note: Totals may not tally due to rounding off. *: Provisional
Figure-1: Monthly Crude Oil Production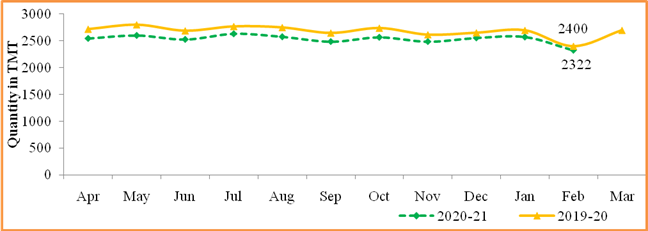
Unit-wise production details with reasons for shortfall are as under:
- Crude oil production by ONGC(Oil and Natural Gas Corporation) in nomination block during February, 2021 was 1544.84TMT which is 2.22%lower than target and7.66%lower when compared with February 2020. Cumulative crude oil production by ONGC during April-February, 2020-21 was 18469.67 TMT which is 3.62%and 2.01% lower than target for the period andproduction during corresponding period of last year respectively. Reasons for shortfall in production are as under:
- Production planned from WO-16 cluster could not be realized due to delay in MOPU (Sagar Samrat) as activities at GPC yard Abu Dhabi got affected due to COVID-19 restrictions / lockdown.
- Production planned from new wells in Ratna field affected due to non- availability of ESPs (Electrical submersible pump) due to implications of COVID-19. Presently rigs are deployed at two well platforms and wells are being completed with ESPs.
- New wells planned under Cluster-8 development project delayed due to delay in installation of new platforms due to COVID implications.
- Crude oil production by OIL(Oil India Ltd) in the nominationblock during February, 2021 was218.49 TMT which is 10.81% % lower than target and 9.06% lower when compared with February 2020. Cumulative crude oil production by OIL during April-February, 2020-21 was 2687.75 TMT which is 5.64% and 5.78% lower than target for the period and production during corresponding period of last year respectively. Reasons for shortfall in production are as under:
- Less than planned contribution from workover wells, drilling wells and old wells.
- Bandhs /blockade by local people and associations after the Baghjan Blowout.
- Crude oil production by Pvt/JVscompanies in the PSC (Production Sharing Contract) regime during February, 2021 was 559.00 TMT which ishigher 14.94% when compared to the February,2020 but 16.48% lower than the monthly target.Cumulative crude oil production by Pvt/JVs companies during April-February, 2021 was 6721.39 TMT which is 10.82% and 13.51% lower than target for the period and production during corresponding period of last year respectively.Reasons for shortfall in production are as under:
- RJ-ON-90/1 (Cairn Energy India Ltd): Delayed start up full field polymer injection in Bhagyam and Aishwarya field. Delay in hook-up of Stage-2 wells and NA-1 processing facility commissioning in advance stage in ABH. Flow cease in few wells of Satellite fields. Project schedule of well and surface facility of Tukaram, Kaam-1 and GSV condensate is impacted by COVID-19.
- RAVVA (Cairn Energy India Ltd): Decline in production from producer wells
- B-80 (Hindustan Oil Exploration Company Ltd): Production from B80 field not commenced due to delay in completion of field development activities because of COVID
- PY-3 (HARDY): Production could not be commenced in PY-3 field.
- Production of Natural Gas
Natural gas production during February,2021 was 2307.12MMSCM which is 19.31% lower than the monthly target and 1.43% lower when compared with February, 2020. Cumulative natural gas production during April-February, 2020-21 was 25986.70MMSCM which is 14.54% and 9.67% lower than target for the period and production during corresponding period of last year respectively. Unit-wise and state-wise natural gas production is given at Annexure-II. Unit-wise natural gas production for the month of February, 2021 and cumulatively for the period April-February, 2020-21 vis-à-vis same period of last year has been shown in Table-2 and month-wise in Figure-2.
Table-2: Natural Gas Production (inMMSCM)
| Oil Company | Target | February (Month) | April-February (Cumulative) | ||||||
| 2020-21 (Apr-Mar) | 2020-21 | 2019-20 | % over last year | 2020-21 | 2019-20 | % over last year | |||
| Target | Prod.* | Prod. | Target | Prod.* | Prod. | ||||
| ONGC | 23982.98 | 1852.25 | 1630.20 | 1869.97 | 87.18 | 21932.99 | 20040.20 | 21840.67 | 91.76 |
| OIL | 2761.73 | 238.14 | 187.88 | 200.79 | 93.57 | 2500.26 | 2269.64 | 2456.64 | 92.39 |
| PSC Fields | 6826.82 | 768.79 | 489.04 | 269.76 | 181.29 | 5976.55 | 3676.86 | 4471.49 | 82.23 |
| Total | 33571.53 | 2859.18 | 2307.12 | 2340.52 | 98.57 | 30409.81 | 25986.70 | 28768.80 | 90.33 |
Note: Totals may not tally due to rounding off. *: Provisional
Figure-2: Monthly Natural Gas Production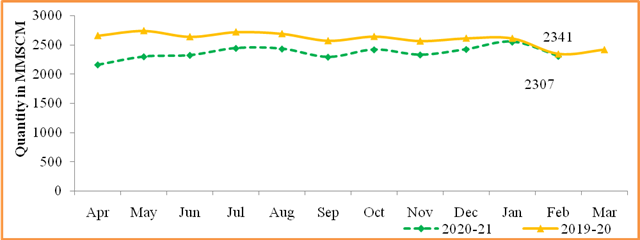
- Natural gas production by ONGC in the nominationblocks during February, 2021 was 1630.20MMSCM which is 11.99% lower than target and 12.82% lower when compared with February 2020. Cumulative natural gas production by ONGC duringApril-February, 2020-21 was 20040.20 MMSCM which is 8.63% and 8.24% lower than target for the period and production during corresponding period of last year respectively.Reasons for shortfall in production are as under:
- Less Gas production from WO16 cluster due to delay in MOPU.
- Less than planned production from Vasistha / S1 wells in Eastern Offshore Assets (EOA) due certain reservoir related issues.
- Less gas intake by Uran Plant for maintenance jobs and less Offtake by consumers.
- Natural gas production by OILin the nomination block during February, 2021 was 187.88 MMSCM which is 21.11% lower than monthly target and 6.43% lower than the February, 2020. Cumulative natural gas production by OIL during April-February, 2020-21 was 2269.64 MMSCM which is 9.22% and 7.61% lower than target for the period and production during corresponding period of last year respectively. Reasons for shortfall in production are as under:
- Low upliftment/demand of gas by the major customers.
- Bandhs /blockade by local people and associations after the Baghjan Blowout.
- Natural gas production by Pvt/JVs companiesin the PSC (production sharing contracts) regime during February,2021 was 489.04MMSCM which is 81.29% higher than the February, 2020 but 36.39% lowerthan monthly target. Cumulative natural gas production by Pvt/JVs during April-February, 2020-21 was 3676.86MMSCM which is 38.48% and 17.77% lower than target for the period and production during corresponding period of last year respectively. Reasons for shortfall in production are as under:
- RJ-ON/6 (Focus Energy Limited): Reduced Gas offtake by buyer.
- KG-DWN-98/2 (Oil & Natural Gas Corpn.): U3-B well is flowing less than the expected profile and delay in commissioning of Wells of U1-field.
- KG-OSN-2001/3 (Oil & Natural Gas Corpn.): Well D-7 is under completion and Testing.
- Raniganj East (Essar Oil and Gas Exploration & Production Ltd): Production is lower due to less sales off-take.
- RJ-ON/6 (Focus Energy Limited): Production is lower due to less sales off-take.
- Crude Oil Processed (Crude Throughput)
Crude Oil Processed during February, 2021 was 18617.41 TMT which is 7.60% lower than the target for the monthand 11.84% lower than February, 2020.Cumulative crude throughput during April-February, 2020-21 was200787.90 TMT which is 12.72% and 13.89% lower than target for the period and crude throughput during corresponding period of last year respectively. Refinery-wise details of the crude throughput and capacity utilization during the month of February, 2021 vis-à-vis February, 2020 are given at Annexure-III and Annexure-IV. Company-wise crude throughput for the month of February, 2021 and cumulatively for the period April-February, 2020-21vis-à-vis same period of last year has been shown in Table-3 and month-wise in Figure-3.
Table 3: Crude Oil Processed (Crude Throughput) (in TMT)
| Oil Company | Target | February (Month) | April-February (Cumulative) | ||||||
| 2020-21 (Apr-Mar) | 2020-21 | 2019-20 | % over last year | 2020-21 | 2019-20 | % over last year | |||
| Target | Prod.* | Prod. | Target | Prod.* | Prod. | ||||
| CPSE | 147377.43 | 11566.49 | 11729.41 | 12168.69 | 96.39 | 134436.88 | 114662.11 | 132454.12 | 86.57 |
| IOCL | 72400.04 | 5259.27 | 5387.06 | 5724.23 | 94.11 | 65846.41 | 56423.74 | 63683.24 | 88.60 |
| BPCL | 33000.00 | 2549.00 | 2674.16 | 2659.50 | 100.55 | 30149.00 | 23462.58 | 28825.59 | 81.39 |
| HPCL | 16999.28 | 1415.75 | 1378.92 | 1515.18 | 91.01 | 16057.23 | 14843.56 | 15665.44 | 94.75 |
| CPCL | 10290.00 | 840.00 | 757.60 | 735.33 | 103.03 | 9370.00 | 7279.35 | 9307.45 | 78.21 |
| NRL | 2549.86 | 197.15 | 227.10 | 224.69 | 101.07 | 2331.59 | 2466.45 | 2135.69 | 115.49 |
| MRPL | 12074.42 | 1300.00 | 1297.36 | 1304.21 | 99.47 | 10624.42 | 10113.15 | 12756.43 | 79.28 |
| ONGC | 63.83 | 5.32 | 7.21 | 5.55 | 129.97 | 58.23 | 73.27 | 80.29 | 91.25 |
| JVs | 14772.00 | 1313.00 | 614.84 | 1680.43 | 36.59 | 13344.00 | 14634.45 | 18456.91 | 79.29 |
| BORL | 7800.00 | 620.00 | 601.47 | 652.22 | 92.22 | 7140.00 | 5587.50 | 7179.70 | 77.82 |
| HMEL | 6972.00 | 693.00 | 13.37 | 1028.21 | 1.30 | 6204.00 | 9046.95 | 11277.21 | 80.22 |
| Private | 89515.16 | 7269.05 | 6273.16 | 7269.05 | 86.30 | 82271.22 | 71491.35 | 82271.22 | 86.90 |
| RIL | 68894.99 | 5667.78 | 4876.36 | 5667.78 | 86.04 | 63370.05 | 56051.02 | 63370.05 | 88.45 |
| NEL | 20620.18 | 1601.27 | 1396.79 | 1601.27 | 87.23 | 18901.17 | 15440.33 | 18901.17 | 81.69 |
| TOTAL | 251664.61 | 20148.54 | 18617.41 | 21118.16 | 88.16 | 230052.09 | 200787.90 | 233182.24 | 86.11 |
Note: Totals may not tally due to rounding off. *: Provisional
Figure 3: Crude Oil Processed (Crude Throughput) 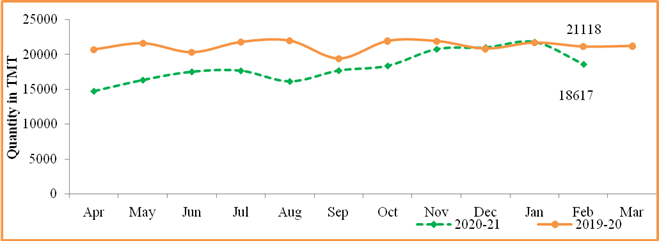
3.1 CPSE Refineries’ crude oil processed during February, 2021 was 11729.41TMT which is 1.41% higher than the target for the month but 3.61% lower when compared with February, 2020.Cumulative crude throughputby CPSE refineries during April-February, 2020-21 was 114662.11TMT which is 14.71% and 13.43% lower than target for the period and crude throughputduring corresponding period of last year respectively.Reasons for shortfall in production are as under:
- IOCL-Digboi: Crude processed lower due maintenance and installation shutdown.
- IOCL-Barauni: Crude processed lower due to lower product upliftment.
- IOCL-Bongaigaon: Crude processed lower due to as per crude availability.
- HPCL-Mumbai: Crude processed lower due to planned shutdown of secondary units.
- HPCL-Visakh: Crude processed lower due to unplanned shutdown of primary and secondary units.
3.2 JV refineries’ crude oil processed during February, 2021 was 614.84TMT which is 53.17% lower than the target for the month and 63.41% lower when compared with February, 2020. Cumulative crude throughput during April-February, 2020-21 was14634.45TMT which is 9.67% higher than target for the period but20.71% lower when compare with the corresponding period of last year respectively.Reasons for shortfall in production are as under:
- BORL-Bina: Crude processed lower due to lower demand of petroleum products amid ongoing COVID-19 pandemic.
- HMEL-Bhatinda: Crude processed lower dueto refinery planned shutdown during the month.
3.3 Private refineries’ crude oil processed during February, 2021 was 6273.16TMT which is 13.70% lower than the corresponding month of last year. Cumulative crude throughputduring April-February, 2020-21 was 71491.35 TMT which is 13.10% lower than thecorresponding period of last year.
- Production of Petroleum Products
Production of Petroleum Products during February, 2021 was 19439.03 TMT which is 5.86% lower than the target for the month and 10.92% lower when compared with February, 2020. Cumulative production during April-February, 2020-21 was 210683.03 TMT which is 10.83% and 12.23% lower than target for the period and production during corresponding period of last year respectively. Unit-wise production of petroleum products is given at Annexure-V. Company-wise production for the month of February, 2021 and cumulatively for the period April-February, 2020-21 vis-à-Vis same period of last year has been shown in Table-4 and month-wise in Figure-4.
Figure 4: Monthly Refinery Production of Petroleum Products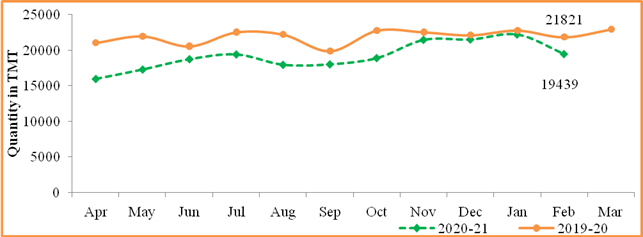
Table 4: Production of Petroleum Products (TMT)
| Oil Company | Target | January (Month) | April-January (Cumulative) | ||||||
| 2020-21 (Apr-Mar) | 2020-21 | 2019-20 | % over last year | 2020-21 | 2019-20 | % over last year | |||
| Target | Prod.* | Prod. | Target | Prod.* | Prod. | ||||
| CPSE | 138753.95 | 10926.31 | 11115.64 | 11691.12 | 95.08 | 126599.88 | 108596.68 | 125255.46 | 86.70 |
| IOCL | 68760.50 | 5009.75 | 5134.48 | 5662.47 | 90.68 | 62520.65 | 54182.96 | 60940.73 | 88.91 |
| BPCL | 31319.00 | 2433.00 | 2545.79 | 2543.13 | 100.10 | 28633.00 | 22381.77 | 27539.65 | 81.27 |
| HPCL | 15914.53 | 1343.13 | 1316.68 | 1418.10 | 92.85 | 15045.41 | 13897.01 | 14568.11 | 95.39 |
| CPCL | 9527.02 | 781.64 | 717.04 | 686.72 | 104.42 | 8671.74 | 6672.73 | 8534.03 | 78.19 |
| NRL | 2554.46 | 199.72 | 222.32 | 217.37 | 102.28 | 2332.36 | 2489.99 | 2050.40 | 121.44 |
| MRPL | 10618.44 | 1154.06 | 1172.80 | 1158.20 | 101.26 | 9341.99 | 8902.39 | 11548.59 | 77.09 |
| ONGC | 60.00 | 5.01 | 6.53 | 5.14 | 127.06 | 54.73 | 69.82 | 73.95 | 94.42 |
| JVs | 13590.40 | 1213.36 | 560.11 | 1534.63 | 36.50 | 12271.92 | 13562.22 | 17208.82 | 78.81 |
| BORL | 6958.40 | 553.36 | 541.06 | 601.74 | 89.92 | 6369.92 | 4909.48 | 6560.55 | 74.83 |
| HMEL | 6632.00 | 660.00 | 19.05 | 932.89 | 2.04 | 5902.00 | 8652.75 | 10648.27 | 81.26 |
| Private | 102154.50 | 8211.58 | 7459.64 | 8211.58 | 90.84 | 93205.01 | 84669.54 | 93205.01 | 90.84 |
| RIL | 82374.12 | 6677.60 | 6100.06 | 6677.60 | 91.35 | 75071.58 | 69702.65 | 75071.58 | 92.85 |
| NEL | 19780.38 | 1533.98 | 1359.58 | 1533.98 | 88.63 | 18133.42 | 14966.89 | 18133.42 | 82.54 |
| Total Refinery | 254498.86 | 20351.24 | 19135.38 | 21437.32 | 89.26 | 232076.81 | 206828.44 | 235669.28 | 87.76 |
| Fractionators | 4523.28 | 298.37 | 303.64 | 384.15 | 79.04 | 4193.95 | 3854.59 | 4369.95 | 88.21 |
| TOTAL | 259022.13 | 20649.61 | 19439.03 | 21821.48 | 89.08 | 236270.76 | 210683.03 | 240039.24 | 87.77 |
Note: Totals may not tally due to rounding off. *: Provisional
- Production of petroleum Products by Oil’s Refineries during February, 2021 was 19135.38 TMT which is 5.97% lower than the target for the month and 10.74% lower when compared with February, 2020. Cumulative production of petroleum products by refineries during April-February, 2020-21 was 206828.44 TMT which is 10.88% and 12.24% lower than target for the period and production during corresponding period of last year respectively.
- Production of petroleum Products by Fractionators during February, 2021 was 303.64 TMT which is 1.77% higher than the target for the month but 20.96% lower when compared with February, 2020. Cumulative production by Fractionators during April-February, 2020-21 was 3854.59 TMT which is 8.09% and 11.79% lower than target for the period and production during corresponding period of last year respectively.
Click here to see Annexure III
********
Also See:
- Record 683.21 LMTs paddy purchased during current KMS
- Customs Officials seize 21 lakh peacock tail feathers